Infrastructure projects can reshape national economies for decades, but their financial scale is difficult to compare. Some publish a revised construction budget; others report expenditure accumulated over several decades, while their wider economic benefits are measured separately. The six projects below illustrate how governments and public authorities finance, build and operate major infrastructure across different continents.
The figures distinguish original budgets, revised estimates, contract values and expenditure to date. These are not interchangeable, and none of the six projects should be interpreted as a definitive ranking of the world’s most expensive infrastructure.
1. Hong Kong, Zhuhai, Macao Bridge, Asia
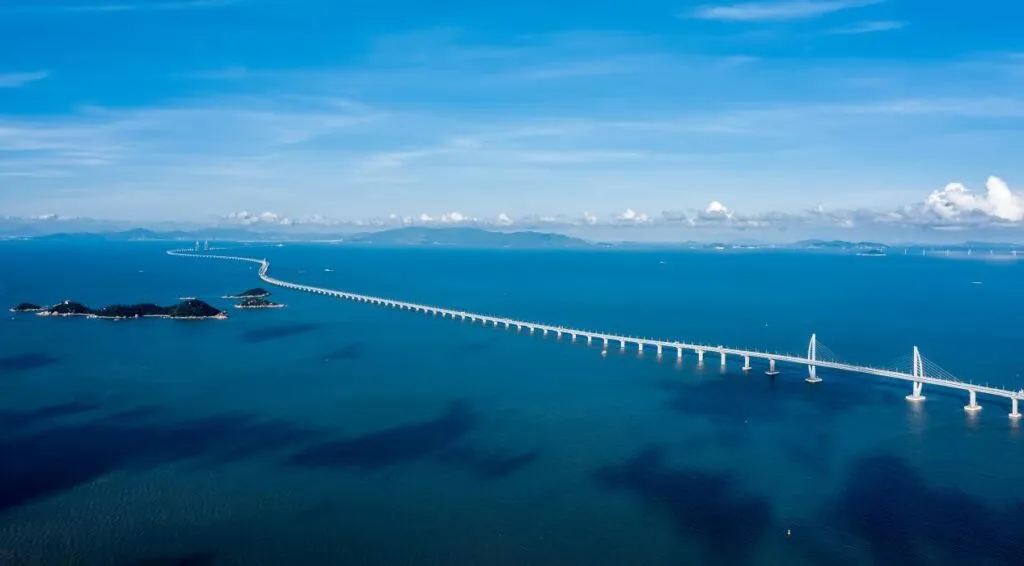
A cross-border transport system connecting three major urban centers
The Hong Kong, Zhuhai, Macao Bridge (HZMB) links Hong Kong, Zhuhai and Macao through a combination of bridges, artificial islands and an undersea tunnel. The project was designed to improve cross-border transport and strengthen economic links within the Greater Bay Area.
In December 2017, Hong Kong authorities approved a revised estimate of RMB48.068 billion for the main bridge, up from RMB38.118 billion approved in March 2010. The increase was approximately RMB9.95 billion. These figures relate to the main bridge estimate and should not be treated as the audited final cost of the entire cross-border transport system.
Cost and financial structure
| Metric | Figure |
|---|---|
| Original approved estimate for the main bridge | RMB38.118 billion |
| Revised approved estimate, December 2017 | RMB48.068 billion |
| Increase in approved estimate | RMB9.95 billion |
The bridge’s economic rationale extends beyond toll revenue. By reducing travel times between the three areas, it was intended to facilitate passenger movement, logistics, tourism and business activity. However, these wider benefits should not be confused with direct project income, and their scale depends on actual traffic, operating costs and the economic activity generated.
The bridge also illustrates a recurring feature of large infrastructure: a headline budget may cover only one component of a wider system. Comparisons with other projects require a consistent definition of what is included in the cost.
Official source: Hong Kong Government, Revised estimate for the main bridge
2. Grand Ethiopian Renaissance Dam, Africa
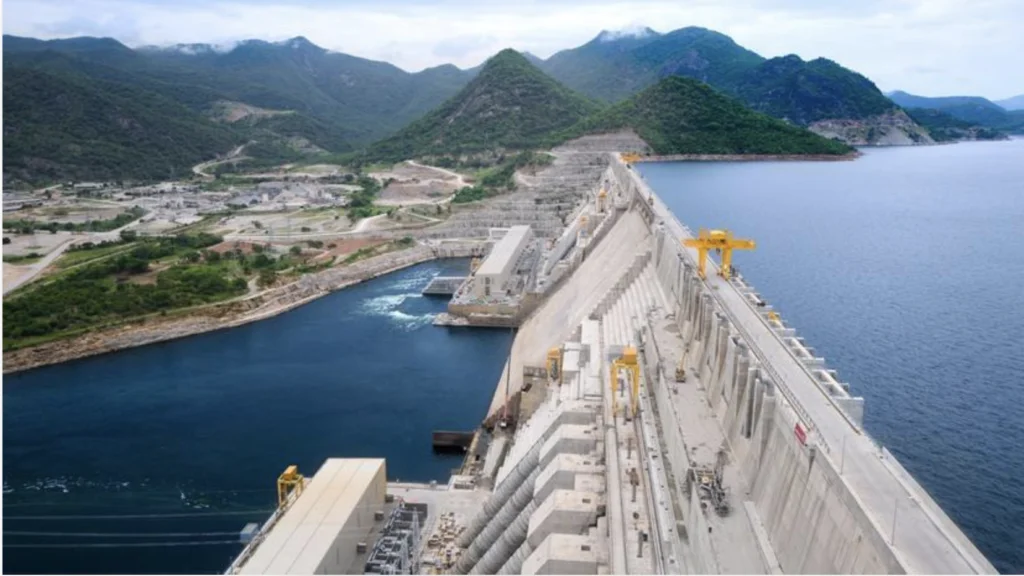
A major hydropower investment intended to expand electricity generation
The Grand Ethiopian Renaissance Dam (GERD), built on the Blue Nile, is one of Ethiopia’s most significant infrastructure investments. Its principal objective is to expand domestic electricity generation, support industrial development and increase access to power.
The project has frequently been associated with an original budget of approximately US$5 billion. That figure should be treated as an initial budget reference, not a verified final construction cost.
In April 2024, Ethiopian Electric Power reported expenditure of 191.3 billion birr and stated that a further 50 billion birr was required to complete the project. These are dated progress figures, not a final audited cost. The dam was subsequently inaugurated in September 2025.
Cost and financial structure
| Metric | Figure |
|---|---|
| Commonly cited original budget | Approximately US$5 billion |
| Expenditure reported in April 2024 | 191.3 billion birr |
| Additional funding reported as required in April 2024 | 50 billion birr |
The project’s economic value depends on the electricity it can reliably supply, the cost of generation, the development of transmission infrastructure and the ability of businesses and households to use that power productively. Hydropower can support industrial output and reduce reliance on more expensive generation sources, but the dam’s construction cost alone cannot establish its economic return.
GERD also sits within a wider regional context. Its operation affects the management of shared Nile water resources, making cooperation over water releases and reservoir management an important part of its long-term economic and political significance.
Official sources: Ethiopian Ministry of Water and Energy, GERD · Ethiopian Electric Power, Completion funding reported in April 2024 · Ethiopian Government, Inauguration announcement
3. HS2, Europe
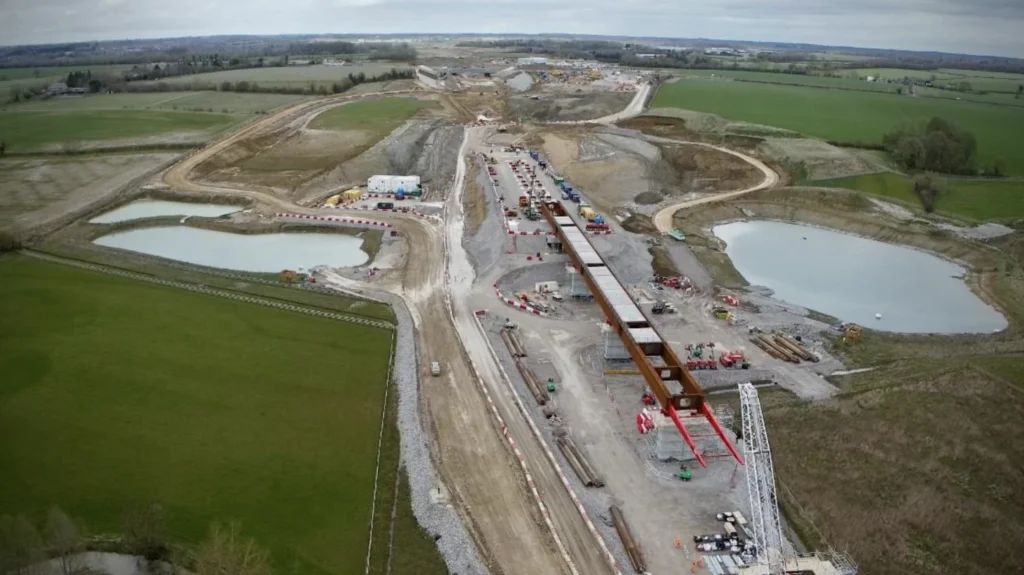
The United Kingdom’s high-speed rail program faces a substantial cost revision
High Speed 2 (HS2) is the UK’s high-speed railway program, intended to increase rail capacity and reduce journey times between major cities. Its development has been marked by changes in scope, schedule and projected costs.
In its May 2026 report to Parliament, the UK government gave a cost range of £87.7 billion to £102.7 billion for the current HS2 program. By the end of March 2026, £44.2 billion had been spent on the program. The report also identifies £2.6 billion associated with the former Phase 2 program; this is a separate category and should not simply be added to, or treated as a component of, the £44.2 billion without explaining the accounting basis.
The government attributed around two-thirds of the cost increase to issues including omitted scope, underestimation and inefficient delivery, with the remainder attributed to inflation.
Cost and delivery
| Metric | Figure |
|---|---|
| Government cost range, May 2026 | £87.7 billion, £102.7 billion |
| Reported expenditure by end of March 2026 | £44.2 billion |
| Separately reported expenditure associated with former Phase 2 | £2.6 billion |
| First section’s current expected opening window | 2036-2039 |
| Full scheme’s current expected delivery window | 2040-2043 |
HS2’s construction involves several major contractors and joint ventures. EKFB brings together Eiffage, Kier, Ferrovial Construction and BAM Nuttall. Other major civil engineering packages have involved Balfour Beatty VINCI and Skanska Costain STRABAG.
The project illustrates why cost control is central to infrastructure economics. A railway’s potential benefits depend not only on its eventual capacity and travel-time savings, but also on the capital invested, the time required to deliver it and the cost of maintaining and operating the network. Delays can postpone benefits while financing and construction costs continue to accumulate.
Official sources: UK Government, HS2 six-monthly report to Parliament, May 2026 · HS2, Direct contract opportunities and suppliers
4. Panama Canal Expansion, North America
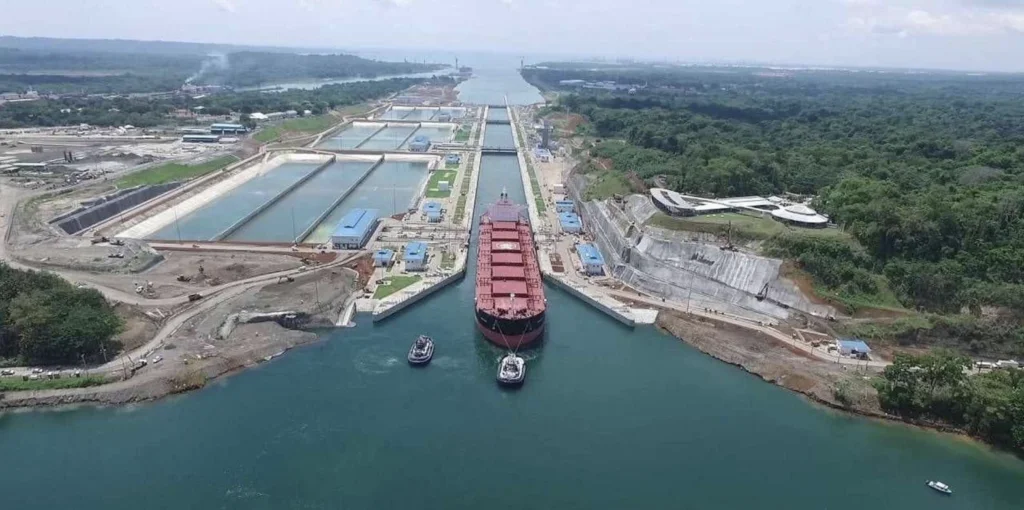
Increasing the capacity of one of the world’s most important shipping routes
The Panama Canal Expansion introduced a new set of locks, allowing the canal to accommodate larger vessels and increasing the range of ships able to transit the waterway. The expansion was intended to strengthen the canal’s competitive position and capture demand from changing global shipping patterns.
In 2009, the Panama Canal Authority announced a program budget of US$5.25 billion. The contract awarded to Grupo Unidos por el Canal (GUPC) for the new locks had a base value of approximately US$3.119 billion. The contract value covered the locks package, not the entire expansion program.
GUPC comprised Sacyr Vallehermoso, Impregilo, Jan De Nul and Constructora Urbana.
Cost and contractors
| Metric | Figure |
|---|---|
| Expansion program budget announced in 2009 | US$5.25 billion |
| Base value of the new-locks contract | Approximately US$3.119 billion |
| Main locks contractor | Grupo Unidos por el Canal (GUPC) |
The expansion’s economic case centers on the additional vessels and cargo that the canal can handle, the tolls generated by transits and the value of maintaining the canal’s relevance to international trade. Its benefits are linked to shipping demand, vessel size, global trade patterns and competition from alternative routes.
The Panama Canal Authority reported preliminary, unaudited fiscal 2025 revenue of B/.5.705 billion and net profit of B/.4.134 billion. Those figures relate to the Authority as a whole, not to the expansion project in isolation. They therefore should not be presented as the expansion’s standalone return on investment.
The distinction matters: a successful operating asset can generate substantial revenue, but determining whether a particular expansion delivered an attractive return requires project-specific costs, incremental income, operating expenses and a defined evaluation period.
Official sources: Panama Canal Authority, Expansion program and budget · Panama Canal Authority, Award of the locks contract · Panama Canal Authority, Preliminary fiscal 2025 financial results · Panama Canal Authority, Expansion overview
5. Itaipu Hydroelectric Dam, South America
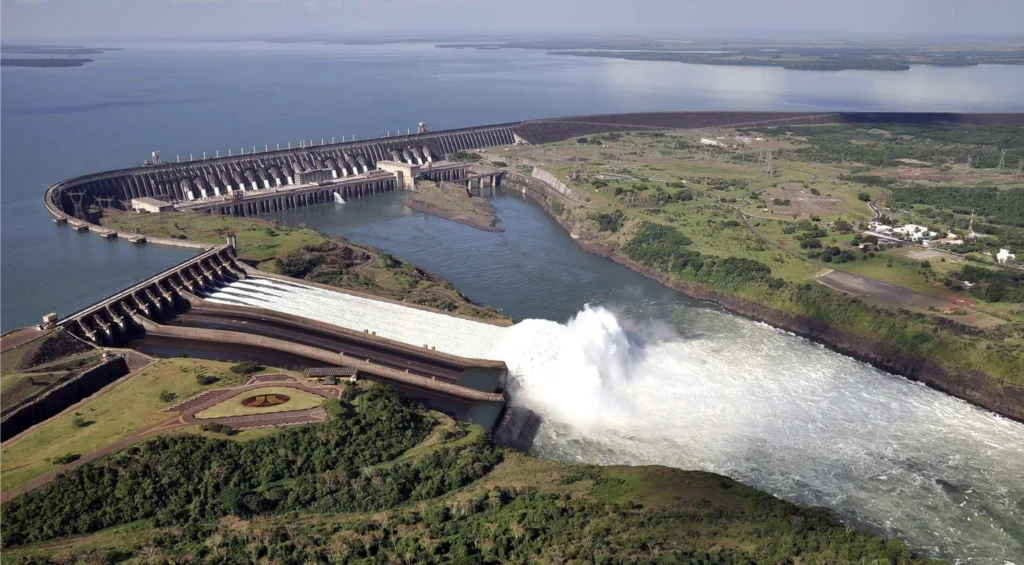
A binational power plant with a long-term role in Brazil and Paraguay
Itaipu is a binational hydroelectric facility developed by Brazil and Paraguay on the Paraná River. With installed capacity of 14,000 MW, it has been a major source of electricity for both countries since generation began in 1984.
In 2024, Itaipu supplied approximately 7% of Brazil’s electricity and 78% of Paraguay’s electricity. These figures demonstrate the plant’s continuing importance to the two national power systems, although annual shares vary with hydrological conditions and total electricity demand.
Capacity and financial context
| Metric | Figure |
|---|---|
| Installed generating capacity | 14,000 MW |
| Start of generation | 1984 |
| Share of Brazil’s electricity supplied in 2024 | Approximately 7% |
| Share of Paraguay’s electricity supplied in 2024 | Approximately 78% |
| Reported fixed and intangible assets at end-2019 | Approximately US$17.6 billion |
The financial history of Itaipu requires careful interpretation. The reported US$17.6 billion in fixed and intangible assets at the end of 2019 included financial charges. Direct investment was reported at approximately US$12 billion in December 2019 terms, while funds raised, including financial rollovers, totaled approximately US$27 billion, alongside US$100 million in share capital. These measures describe different aspects of the project’s financial history and should not be added together as if they were equivalent construction costs.
Construction involved large Brazilian and Paraguayan consortia, including Unicon and Conempa for civil works, and Itamon and CIE for electromechanical assembly. Companies involved included Camargo Corrêa, Andrade Gutierrez, Mendes Júnior, Techint, Siemens and Voith.
Itaipu’s value is not limited to electricity sales. Reliable power supports industrial activity, households and public services, while the binational structure distributes benefits and obligations across two countries. At the same time, royalties and other transfers must be distinguished from commercial profit: the approximately US$14.5 billion reported in royalties over time represents public transfers, not a standalone measure of profit or return on investment.
Official sources: Itaipu, Institutional and public information · Itaipu, Itaipu in Numbers, 2023-2025
6. Sydney Metro West, Oceania
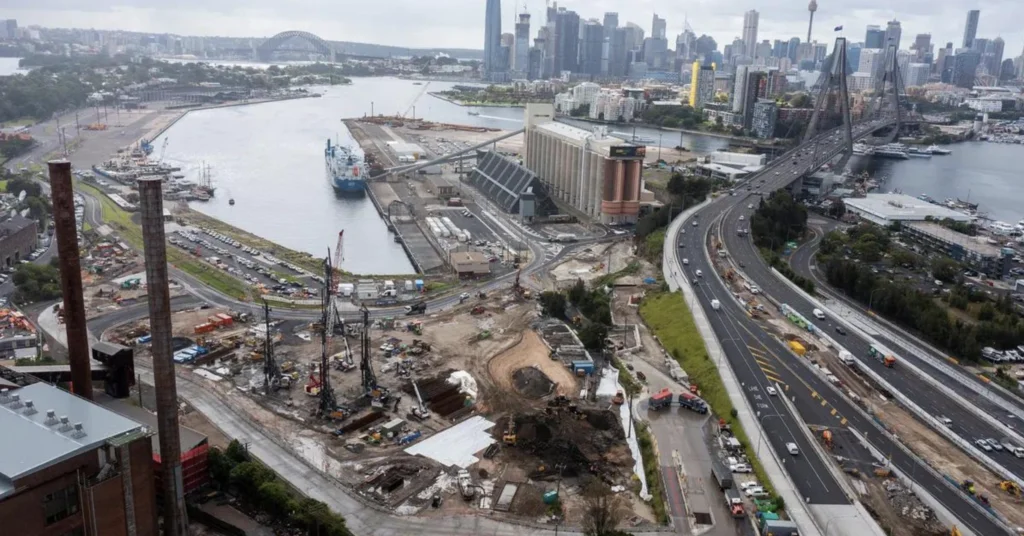
A new metro line intended to increase capacity across metropolitan Sydney
Sydney Metro West is a major rail infrastructure program designed to improve public transport between Greater Parramatta and central Sydney. The project includes new stations, tunnels, rail systems, trains and supporting facilities.
The New South Wales government has published an updated estimated cost range of A$27 billion to A$29 billion. The state’s auditor reported that A$11.79 billion had been spent by 30 June 2025. That figure is expenditure to date, not the final project cost.
In January 2026, the government announced four major contracts with a combined value of approximately A$11.5 billion. These contracts cover different parts of the project and should not be added to expenditure-to-date figures to derive a total cost: contract commitments and recorded expenditure measure different things and may relate to overlapping delivery periods.
Cost and major contracts
| Metric | Figure |
|---|---|
| Current estimated project cost | A$27 billion, A$29 billion |
| Expenditure reported by 30 June 2025 | A$11.79 billion |
| Four major contracts announced in January 2026 | Approximately A$11.5 billion |
| Target for passenger services | 2032 |
| Contractor or consortium | Main scope | Announced contract value |
|---|---|---|
| John Holland | Track laying, rail systems, ventilation, fire systems, cross passages and the Clyde stabling and maintenance facility | A$3.2 billion |
| Gamuda | Design and construction of five stations in the western section | A$2.85 billion |
| Metro Trains West, led by MTR with CRRC | Tunnel fit-out, trains, systems, maintenance and operating responsibilities | A$3.96 billion |
| Lendlease, Mirvac and Coombes Property Group | Hunter Street station and associated development | A$1.5 billion |
The project’s economic rationale includes additional public transport capacity, improved connections between employment centers and potential development around new stations. These benefits depend on ridership, service reliability, the final operating model and the degree to which the line reduces congestion or supports more productive travel.
The New South Wales auditor has also highlighted limitations in the transparency of public reporting around the project’s total cost and budget changes. That makes it particularly important to distinguish announced contract values, expenditure to date and the government’s current estimate rather than presenting them as a single reconciled figure.
Official sources: New South Wales Government, Metro West contracts · New South Wales Government, Updated project costs · Audit Office of New South Wales, Capital projects 2025
Beyond the Largest Projects: Two Additional Infrastructure Models
Not every strategically important infrastructure investment is a megaproject. Smaller, distributed systems can produce significant economic and social benefits without having the headline cost of a dam, railway or international bridge.
NEWater, Singapore
Singapore’s NEWater program treats used water using advanced purification technologies to produce high-grade reclaimed water. It forms part of the country’s strategy to diversify water supplies and improve resilience in a water-scarce environment.
Its economic significance lies in supply security, reduced exposure to external water constraints and the availability of a reliable source for industrial and other uses. NEWater should be understood as part of Singapore’s wider water system, rather than assessed through a single headline claim about the percentage of national demand it meets. Singapore’s national water agency, PUB, states that NEWater and desalination are expected together to meet the majority of water demand by 2065.
Official source: PUB Singapore, The Water Loop
Rural Electrification, Ethiopia
Rural electrification illustrates how a series of smaller infrastructure investments can extend economic opportunity across a large population. According to the World Bank, an Ethiopian electrification program facilitated more than 1.6 million grid connections, serving over eight million people and more than 19,000 public facilities. The program also supported 11 mini-grids serving nearly 20,000 people in remote communities.
Electricity access can improve the operation of schools and health facilities, enable businesses to use equipment and extend productive hours. The eventual economic impact depends on affordability, reliability, connections to productive users and the availability of complementary infrastructure.
Official source: World Bank, Lighting up Eastern Africa: Rural Ethiopia
What Determines the Economic Return on Infrastructure?
Construction cost alone does not determine whether infrastructure represents a good investment. A meaningful assessment needs to distinguish at least four financial and economic dimensions.
Capital expenditure measures the resources committed to building the asset. Original budgets, revised estimates, contract awards and expenditure to date answer different questions and should be labelled accordingly.
Operating performance measures how the completed asset performs in practice: electricity generated, passengers carried, ships served, water supplied or travel time saved. These metrics help establish whether the asset is delivering the service for which it was built.
Direct financial returns include tolls, fares, electricity sales and other project revenues, less operating and maintenance costs. Where an authority operates multiple assets, its total revenue or profit cannot automatically be attributed to one project.
Wider economic benefits may include productivity improvements, regional development, improved access to services and greater resilience. These benefits can be substantial, but they require their own evidence and should not be presented as cash returns unless they have been measured and monetised appropriately.
The six projects demonstrate why transparent reporting matters. HS2 highlights the consequences of cost revisions and delivery delays. The Panama Canal shows the importance of separating an operating authority’s financial performance from the economics of a specific expansion. Itaipu illustrates how a long-lived energy asset can become central to national electricity supply, while GERD demonstrates the need to date funding and expenditure figures carefully. The HZMB and Sydney Metro West show why estimates, contracts and expenditure must remain distinct.
Infrastructure creates lasting value when the services and economic activity it enables justify the capital invested over the asset’s useful life. Establishing that value requires more than a headline budget: it requires consistent cost definitions, transparent delivery reporting and evidence of the benefits actually realised.