Record Data Sheet
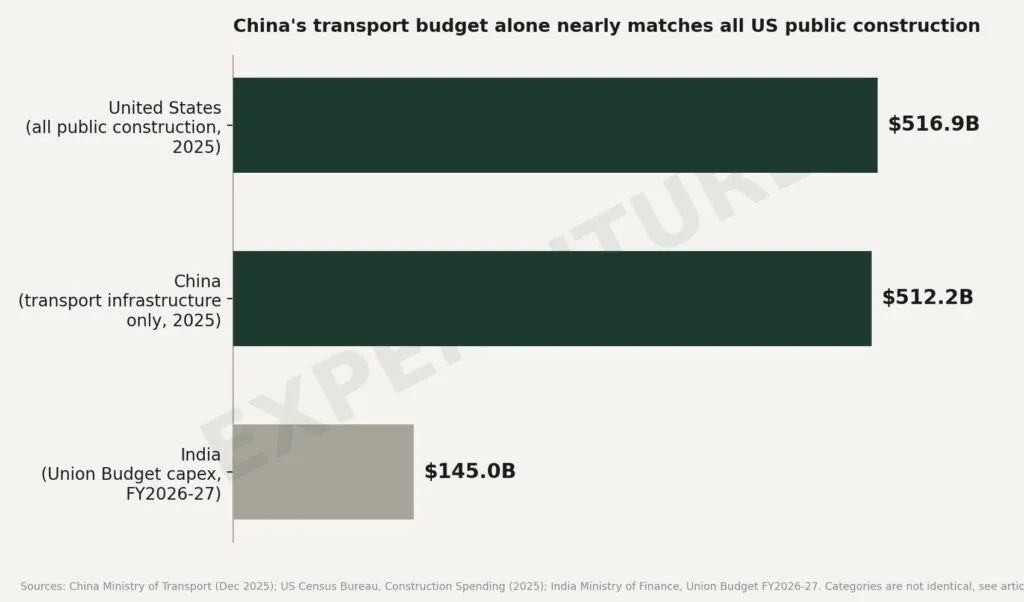
Three governments released infrastructure spending figures for 2025 and early 2026, each from its own official statistics agency, each measuring something slightly different, and none of them designed to be compared to each other. Put the three official numbers side by side anyway and one comparison stands out enough to justify the exercise: China’s Ministry of Transport alone spent more on transportation infrastructure in 2025 than the United States spent on every category of public construction combined, schools, highways, water systems, government buildings, all of it.
A methodology warning before the numbers, because it matters more than usual here
No two of these three governments define “infrastructure spending” the same way, and that difference is the actual story as much as the totals are. China’s figure, reported by its Ministry of Transport, covers transportation only, railways, roads, waterways, and civil aviation, and excludes energy, water, telecommunications, and social infrastructure entirely. The US figure, from the Census Bureau’s Construction Spending survey, covers all public construction, federal, state, and local combined, spanning highways, schools, hospitals, water systems, and government buildings. India’s figure is its Union Budget’s total capital expenditure, which includes infrastructure but also defense equipment purchases and other capital assets that aren’t infrastructure in the way the other two figures use the term.
None of that makes the comparison meaningless. It makes the comparison a lesson in itself: any claim that one country “spends more on infrastructure” than another needs the same question asked back, spends more on which category, measured by which agency, using which definition.
China: ¥3.6 trillion ($512.2 billion), transportation only, and what it actually built
China’s Ministry of Transport announced in December 2025 that the country’s transport fixed-asset investment for the year would exceed 3.6 trillion yuan ($512.2 billion), according to Vice Minister of Transport Li Yang. Roads accounted for roughly 2.6 trillion yuan ($370 billion) of that figure and railways for about 901.5 billion yuan ($129.2 billion), according to Ministry of Transport figures reported at the same briefing.
What that bought, physically, in 2025 alone: more than 2,000 kilometers of new high-speed rail and roughly 8,000 kilometers of new expressways, according to the Ministry’s own year-end account. Zoom out to the full 2021 to 2025 planning period and the scale compounds further: 18.8 trillion yuan ($2.78 trillion) in cumulative transport fixed-asset investment, the fastest five-year expansion in the country’s history, according to Vice Minister Xu Chengguang, taking China’s total transport network past 6 million kilometers and its high-speed rail network past 50,000 kilometers, more than the rest of the world combined.
The more significant signal is where China says this spending goes next. The Ministry of Transport has confirmed that its national transport network is now 91% complete under its own targets, and that the country is pivoting during the 2026 to 2030 Five-Year Plan period from building new infrastructure toward upgrading roughly 80,000 kilometers of existing transport infrastructure, alongside continued rural road construction. The era of measuring China’s transport ambitions in new kilometers built is, by the ministry’s own account, ending.
United States: $516.9 billion, every public construction category combined, spent more slowly than it looks
The US Census Bureau’s Construction Spending survey put total US construction spending at $2.1644 trillion for 2025, of which $1.6475 trillion was private construction, leaving approximately $516.9 billion in public construction, the figure that most closely approximates infrastructure spending in US statistics. That total was essentially flat year over year, part of a broader 1.4% decline in overall US construction spending in 2025 compared to 2024.
What the money bought is harder to state in a single number than China’s kilometers-built figures, and that difficulty is itself informative. According to the US Government Accountability Office, the Department of Transportation had obligated more than $260 billion of the almost $438 billion in IIJA grant funding authorized for fiscal years 2022 through 2025, as of April 2025, leaving about 41% of authorized funding still unobligated. The Congressional Research Service, in its own analysis of Federal Highway Administration data, reports that roughly 42,000 of the country’s approximately 624,000 bridges longer than 20 feet remained classified in poor condition as of June 2025. Average annual federal bridge spending during the IIJA period has run about $12.04 billion, 22% higher in inflation-adjusted terms than under the prior authorization law, a pace that, per FHWA’s own needs analysis cited by the CRS, could cut the bridge investment backlog by roughly 90% if sustained over 20 years.
India: ₹12.2 lakh crore ($145 billion) in total capital spending, with the fastest visible construction pace of the three
India’s Union Budget for fiscal year 2026-27 set total capital expenditure at 12.2 lakh crore rupees ($145 billion), according to the country’s Ministry of Finance, the smallest of the three figures by a wide margin but the one growing fastest as a share of the national budget.
The National Highways Authority of India alone spent 244,362 crore rupees ($29.3 billion) on national highway development in fiscal year 2025-26, according to the Ministry of Road Transport and Highways, exceeding its own budgetary support of 238,384 crore rupees by drawing on its own additional funds. That spending built 5,313 kilometers of national highway, 15% above the government’s own 4,640 kilometer target, at a national construction pace of roughly 34 kilometers per day, up from about 12 kilometers per day a decade earlier. India’s National Highway network, now 146,560 kilometers, has become the world’s second largest road network, behind only the United States’ full road system.
India’s capital expenditure figure is also the broadest of the three in one specific sense: it includes defense capital acquisitions alongside transportation, energy, and urban infrastructure, so it is not a pure infrastructure figure any more than the US or China numbers are pure, just broad in a different direction.
Sizing these numbers against something real
The $512.2 billion China’s Ministry of Transport spent on transportation alone in 2025 is larger than the entire annual gross domestic product of Norway ($480 billion in 2024, World Bank). The $516.9 billion the United States spent on all public construction combined sits close to the entire GDP of Ireland (roughly $560 billion in 2024, World Bank). India’s $145 billion in capital expenditure is closest in scale to the GDP of New Zealand (roughly $252 billion in 2024, World Bank), making India’s capex about 58% of a mid-sized advanced economy’s total annual output on its own.
Which country spends its money best, and why that’s the wrong question to ask directly
The tempting next step is to divide each budget by the kilometers built and declare a winner on cost per kilometer. That comparison would be a mistake, and worth explaining why. Construction labor costs in India run a small fraction of construction labor costs in the United States. Land acquisition costs, terrain, material prices, and wage levels differ so much across these three economies that a lower cost per kilometer in India or China mostly reflects the underlying cost of labor and land in each country, not superior execution. Comparing raw unit costs across countries with this different a cost structure measures exchange rates and wage gaps, not efficiency.
The more honest way to judge execution quality is to compare each country against its own baseline, not against the others’ cost structure. On that measure, three different pictures emerge. India shows the clearest documented improvement over time: its own national construction pace nearly tripled, from about 12 kilometers a day a decade ago to roughly 34 kilometers a day in fiscal year 2025-26, and NHAI beat its own annual target by 15%, a same-country, same-currency comparison that isolates a genuine gain in execution rather than a currency or wage effect. The United States shows the clearest documented concern, also on a same-country basis: the Government Accountability Office’s own finding that 41% of authorized IIJA funding remained unobligated as of April 2025, alongside 42,000 bridges still rated in poor condition according to the Congressional Research Service, is a red flag about execution speed that has nothing to do with comparing US costs to India’s or China’s. China’s system, by its own account, is shifting from a construction-volume metric to a maintenance-quality metric for the 2026 to 2030 period specifically because the build-out phase is ending, which means its execution quality on the metric that will actually matter going forward, keeping 6 million kilometers of existing network in good repair, has not yet been tested at scale.
Judged this way, the evidence supports a narrower claim than “who spends best.” India shows the clearest gain in execution speed and target discipline, not because its money is being spent more wisely, but because its own pace of delivery has measurably accelerated over time. The United States shows the clearest documented lag, not in cost efficiency, but in deployment: money appropriated that has not yet turned into obligated, working capital, according to the government’s own auditor. Whether either country is getting better value for each dollar, rupee, or yuan spent, as opposed to simply moving faster or slower, is a different question, and one neither country’s public data answers cleanly yet. China’s real test, on any measure, is still ahead of it.
Why we consider this relevant
The headline comparison, China’s transport-only spending nearly equaling all US public construction, is startling precisely because it isn’t a fair fight, and that unfairness is the point. It shows how differently the two governments organize and report capital spending: China concentrates enormous, centrally coordinated investment in a single infrastructure category tracked by one ministry and reported in physical units, kilometers of rail, kilometers of expressway, while the United States spreads public capital spending across thousands of state, county, and municipal budgets with no single agency tracking a transportation-only total the way China’s Ministry of Transport does, and with a documented gap between dollars appropriated and physical capacity actually delivered.
India offers a third model entirely: a much smaller absolute budget, but one where a single implementing agency, NHAI, publishes both the rupee figure and the exact kilometer count built against an explicit annual target, making it, by a meaningful measure, the most transparently self-audited of the three systems examined here.
For anyone using government infrastructure statistics to make investment, sourcing, or policy decisions, the lesson generalizes well beyond these three countries: a spending total without a matching physical output figure, kilometers built, bridges repaired, capacity added, is only half a data point. The size of a country’s headline number often says as much about how centralized its statistics collection is as it does about how much concrete actually got poured.
Frequently asked questions
Not exactly, and the comparison requires care. China’s $512.2 billion figure covers transportation infrastructure only. The United States’ $516.9 billion figure covers all public construction,
transportation, education, water systems, and government buildings combined. The US figure is technically larger, but it spans a much broader category than China’s transport-only number.
Approximately $516.9 billion, calculated from the US Census Bureau’s official figures of $2.1644 trillion in total 2025 construction spending minus $1.6475 trillion in private construction spending.
₹12.2 lakh crore ($145 billion) in total capital expenditure for fiscal year 2026-27, according to India’s Ministry of Finance. Within that, the National Highways Authority of India alone spent
₹244,362 crore ($29.3 billion) building 5,313 kilometers of national highways in fiscal year 2025-26.
More than 2,000 kilometers of new high-speed rail and roughly 8,000 kilometers of new
expressways, according to China’s Ministry of Transport.
Not away from it entirely, but toward a different kind of it. China’s Ministry of Transport says its national transport network is now 91% complete under its own targets, and the country plans to prioritize upgrading roughly 80,000 kilometers of existing infrastructure over new construction during the 2026 to 2030 Five-Year Plan period.
Only partially, according to the government’s own oversight findings. The Government Accountability Office found that 41% of authorized IIJA grant funding remained unobligated as of April 2025, and the Congressional Research Service reports that roughly 42,000 US bridges remained in poor condition as of June 2025, out of about 624,000 total bridges nationwide.
18.8 trillion yuan ($2.78 trillion), between 2021 and 2025, according to China’s Ministry of Transport, describing it as the fastest expansion in the country’s history.